
QSDA Calctime
QSDA Calctime (charts deconstruction) measures how long each chart on the open sheet takes to calculate, shows the time as a badge on the chart and breaks it down by dimension and expression, so you can find the slow ones.
Open a sheet
The tool works on a sheet, not on the app overview.
Open QSDA Calctime
Popup or side panel → Tools → QSDA Calctime, or the extension icon menu → Tools → QSDA Calctime (opens the side panel).
Read the badges
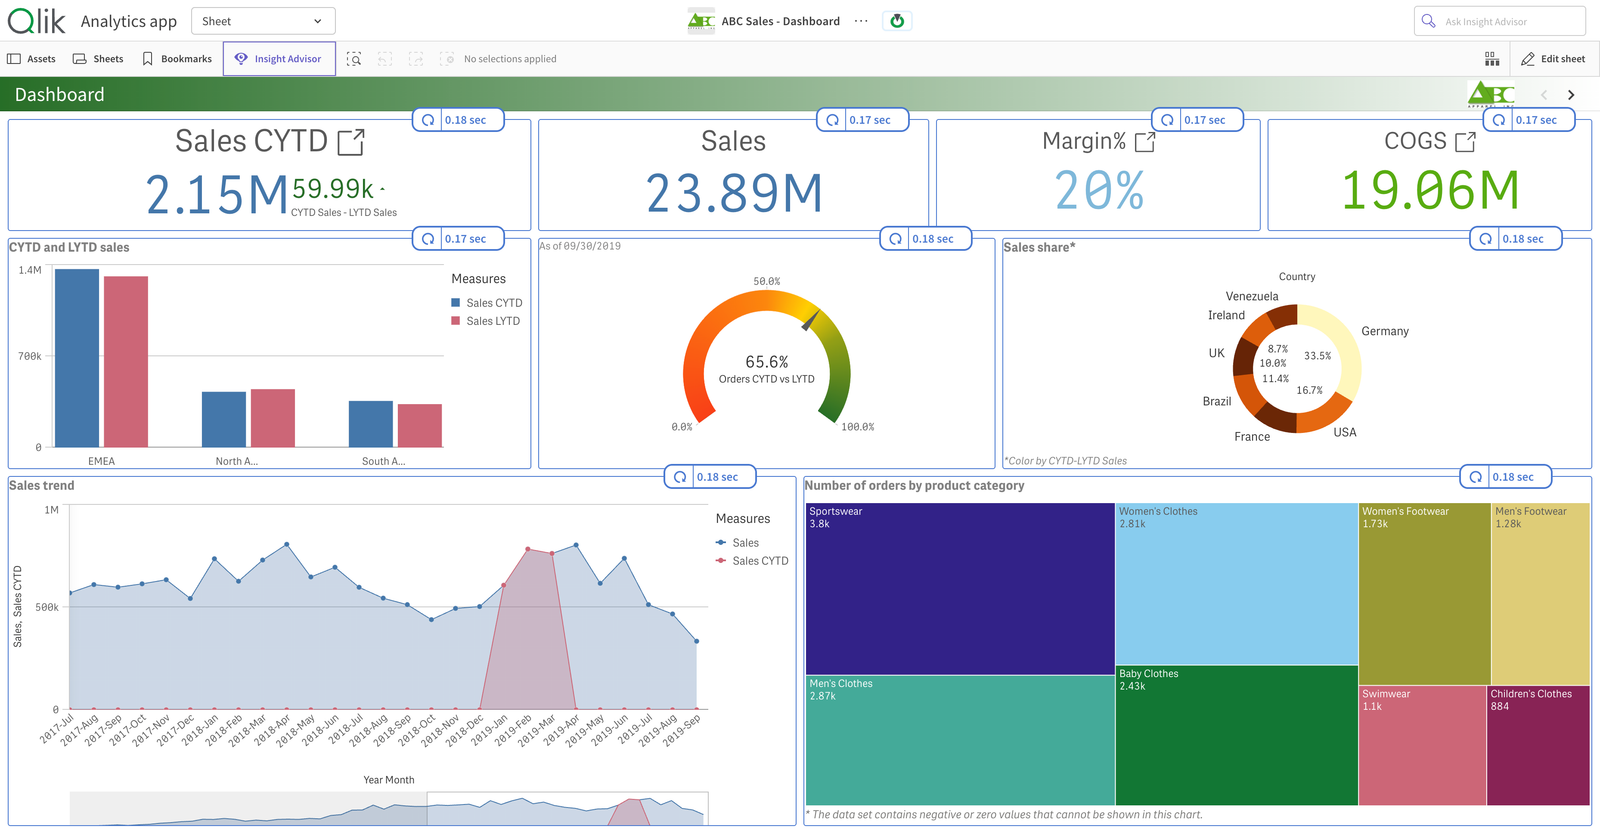
Every chart gets a frame and a badge with its calculation time and a refresh icon to measure again. The history of measurements for a chart is kept for the session, which makes it easy to compare before and after a change.
Deconstruct a chart
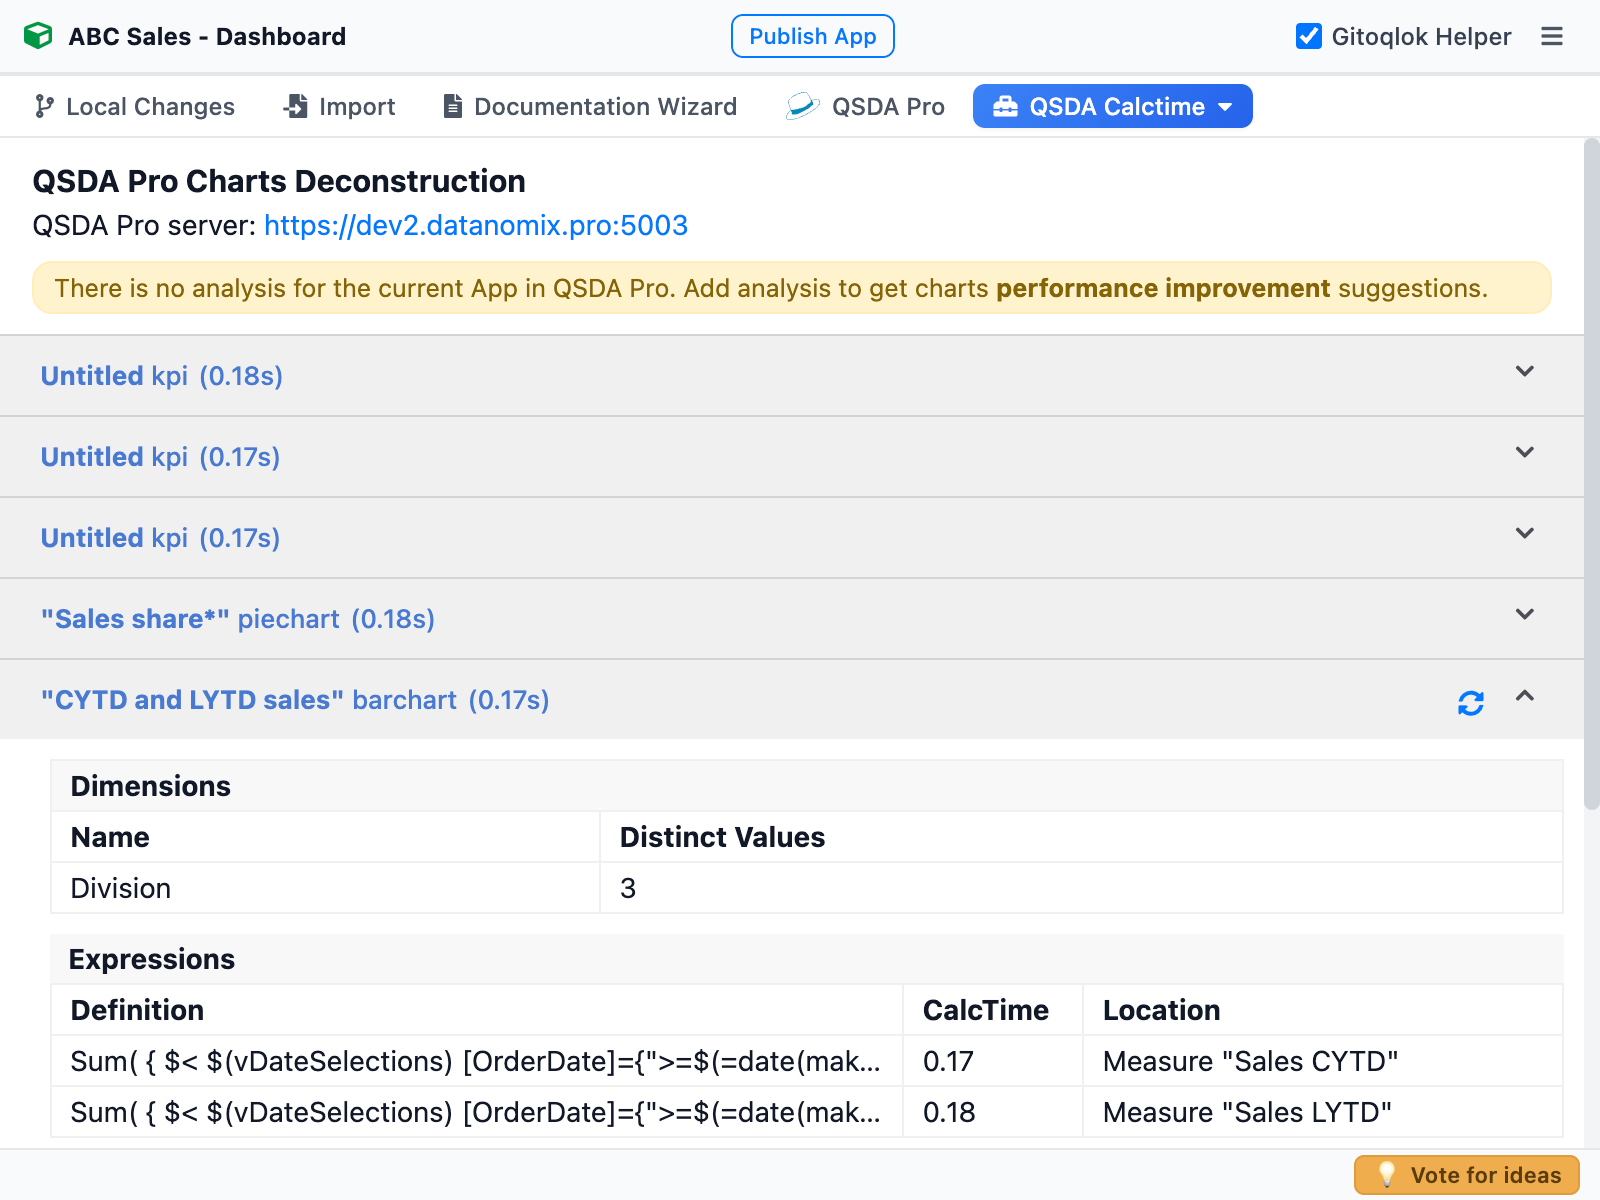
The tab lists the charts of the sheet with their times. Expand a chart to see the Dimensions with their number of distinct values and the Expressions with the calculation time of each and where it is used.
How it measures
Gitoqlok creates temporary session objects for the chart and for each of its expressions, asks the engine to calculate them and measures the response time. Nothing is saved in the app.
With QSDA Pro
When a QSDA Pro server is connected and has an analysis of the app, charts with flags get an orange marker on the badge; click it to read the flag in the tab. Without an analysis the tab suggests creating one.
Limits
Without a license the deconstruction tables are available for 10 charts per app; badges are always shown. See License, or request a free 30-day trial.